Introduction
The purpose of this guide is to provide information about how to troubleshoot system issues that may occur during transaction processing via the gateway. You can familiarize yourself with the most common issues that may arise and the ways of resolving them.
Intended Audience
This guide will be useful for system administrators that deal with the system malfunctions preventing transactions to be processed.
System Monitoring with JavaMelody Application
Overview
JavaMelody is a service designated to monitor Java virtual machine (JVM) and Java applications in the testing and production environments. It is used by DevOps to monitor the status of the system and RAM, to diagnose situations when transaction processing stops and when a memory leak occurs. JavaMelody can be accessed via the following link:
https://[server-name]/monitoring.
JavaMelody provides basic information about the system and its technical characteristics, including the amount of RAM involved, information about users in the system, etc. It also includes summary charts showing the evolution over time of the following indicators:
- number of executions, mean execution times and percentage of errors of HTTP requests, SQL requests;
- Java memory;
- Java CPU;
- number of user sessions;
- number of JBDC connections.
These charts can be viewed for a current day, week, month, year or any custom period. For more information, please review the
JavaMelody user guide.
Rules
- Highly important: you must exercise caution when working with the service, because it has functions that can result in an application crash. We recommend to analyze the diagrams and contact DevOps when diagnosing the problem, because pressing certain buttons within the JavaMelody service may cause the server to stop.
- To use JavaMelody you must have a human user with a System 2 access level. If you don’t have enough rights to access JavaMelody, address the issue to your gateway administrator or gateway support. Access can be granted via the User Details form on the User perspective.
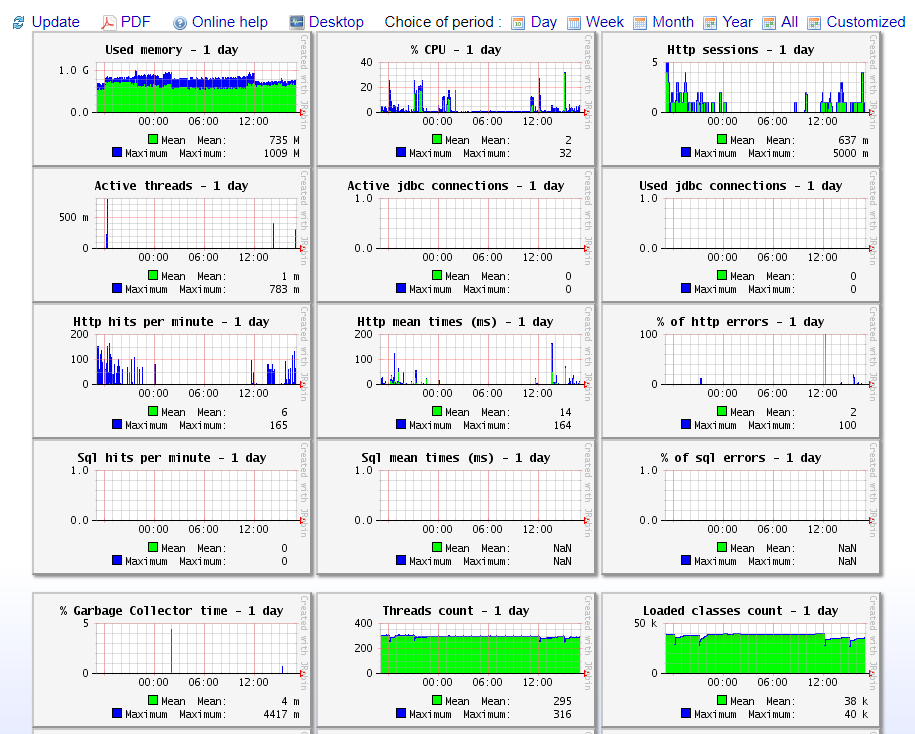
- To open JavaMelody, use the following URL: https://[server-name]/monitoring, where server-name is the name of the server for which you want to obtain information. The opened page should look similar to this one. Using this page, you can analyze the problem in real-time as well as see the general situation both on the server and individual nodes.
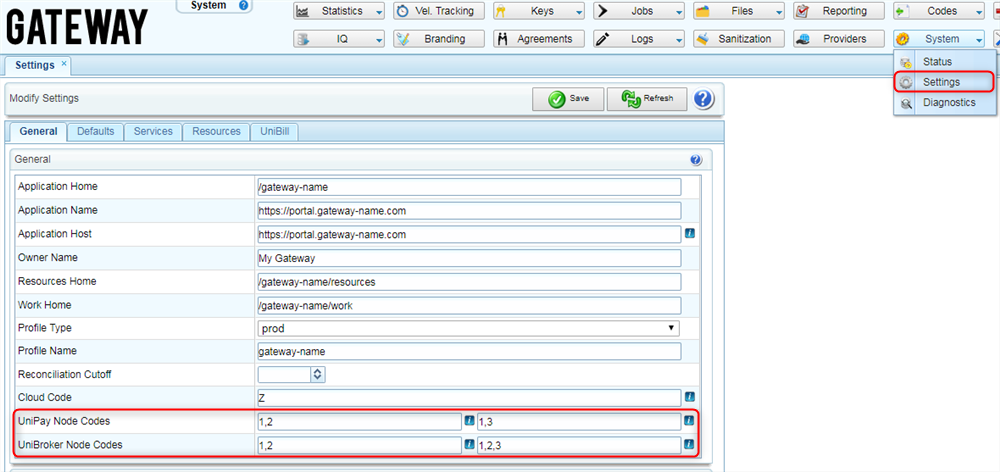
- To view information about each of the available UniPay and UniBroker nodes, use the buttons with the node names located at the top section of the screen. If you need to set/change node names, use the Settings form on the System perspective.
5. The main JavaMelody tool is charts. For diagnostic purposes, only the
% Garbage Collector time,
Used memory,
% CPU,
Active JBDC connections and
System load charts are used.
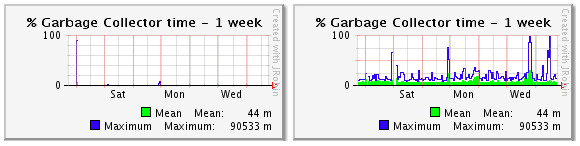
- Check % Garbage Collector time chart. If there are no issues, it will be empty.
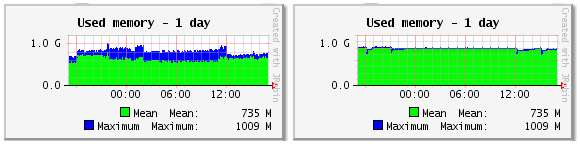
- Check Used memory chart. If there are no issues, it will look like a block with interrupts.
- Check % CPU, Active JDBC connections and System load charts.
- To determine when the issues began, compare the same charts for the day and for the week.
- In cases when any of the charts show a problematic situation, please contact DevOps to resolve it.
6. The
System Information section provides information about the computer/server (about JVM and hardware), JVM settings, how much RAM and hard drive memory JVM has. Check this section to verify how much memory is allocated and how much physical memory is available at the moment.
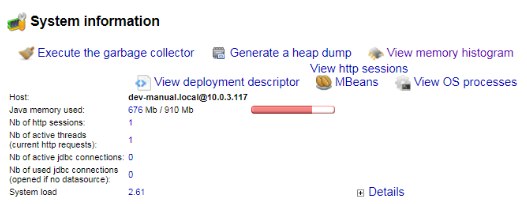
- Check the Java memory used parameter, which shows the amount of used memory. In this case, the red strip is the indicator. It must not reach the edge.
- Check the Xms and Xmx parameters, which are shown when you click the Details button at the bottom of the section. They indicate how much RAM is allocated for JVM. Note: we suggest allocating 80-85% of RAM for JVM.
7. The
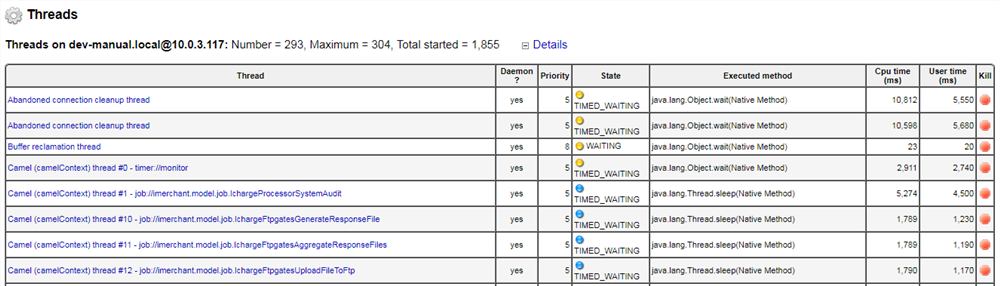
Threads section provides information about threads with or without unusual behavior in the past or present. Check this section when the system has freezes (for example, an API request cannot be processed and a timeout error is returned). In this scenario, a status is an indicator. Most commonly, the status of an unexpected behavior is either
sleep or
runnable. You can view the
JavaMelody user guide for more information.
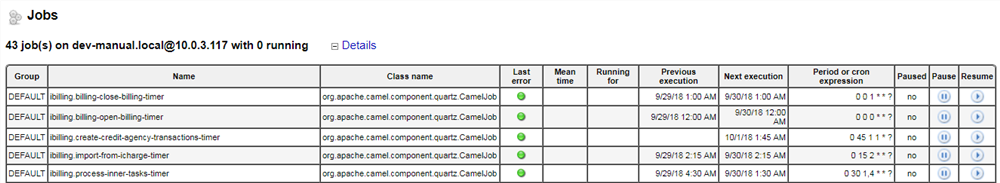
8. In the
Jobs section, you can find information about the timers showing which jobs, and when each is being run on a particular node. It is highly recommended to not use JavaMelody, and instead use the Jobs form on the System perspective to obtain information regarding timers.
9. The following buttons are used for diagnostic purposes:
- Execute the garbage collector - runs the garbage collector service. It is usually run automatically by the system itself when a problem occurs. Run the garbage collector to identify the problem in controversial situations and when the Java memory used parameter is shown as ⅘ used. Note that calling this service will cause the server to freeze for a few minutes. In case of a long freeze (several minutes), all transactions made during this period will be rolled back returning the timeout error.
- Generate a heap dump - freezes the server for several hours to generate a heap dump. The size of the head dump will be the same as the size of the available heap memory. For example, if the heap size is 4 GB, the dump will be 4 GB as well.
- View memory histogram - shows objects, which are currently stored in the memory. When you have an issue with system memory, you should check the main table that is opened via this button. To get more information, click the Details button in the right bottom section of the screen.
- View OS processes - shows the system processes that are currently running.

Use Cases
Problems with transaction processing
Definition:
There may be a problem when the volume of transactions increases, but the server memory on JVM/JBoss is not allocated enough space for these transactions to be processed successfully. Due to the large number of transactions and the lack of RAM on JBoss, tasks that close retail transaction cycles may fall or API requests may stop passing through the gateway. In such cases, administrators receive system audit messages, and information about the dropped transaction processing tasks is shown in the logs. For example, the following system audit notifications may be received:
| Date
|
Account ID
|
Node
|
Code
|
Message
|
| 04/04 19:20:06
|
2001
|
1
|
W01
|
Processing time exceeds expected limit. ID: 107071304; MAC: 2001; Start Time: 04/04 19:19:52; End Time: 04/04 19:20:03; Duration: 11.57s
|
| 04/04 19:17:55
|
3001
|
3
|
|
GC overhead limit exceeded
|
| 04/04 19:11:25
|
2001
|
1
|
|
Exception rolled back, status is: 9
|
| 04/04 19:09:45
|
2001
|
2
|
|
Transaction was rolled back in a different thread!
|
| 04/04 19:09:35
|
3001
|
3
|
|
JBAS014585: Transaction 'TransactionImple < ac, BasicAction: 0:ffff0a57d248:1e167d4d:5ac482a1:2aef6b status: ActionStatus.ABORTED >' was already rolled back
|
- Log in to JavaMelody using the link: https://[server-name]/monitoring.
- Check the following charts of the system and memory states on each node:
- Used Memory chart shows the use of memory by the system. The left screenshot below shows that memory is used evenly. The right one shows that there is a problem with the used memory. To resolve the issue, contact gateway support.
- % Garbage Collector time chart shows when and how many times garbage collector was run (by the system and/or an administrator). The left screenshot below shows that there are no problems and the garbage collector was not run. The right one shows that the garbage collector is run regularly. To resolve the issue, contact gateway support.
JavaMelody does not display all nodes
Definition:
There may be a situation when a clustered UniPay configuration is used, but only one node is present in JavaMelody. The reason for this issue is that not all nodes are specified in the system settings.
Action:
- Open the following page: https://[server-name]/pingdom/node.jsp and check how many nodes are shown in the response.
- If there is more than one node (for example: 3 [unipay1, unipay2, unipay3]), go to the Settings form on the System perspective, and set the codes of all nodes in the UniPay Node Codes and UniBroker Node Codes fields.
- Re-open JavaMelody - all nodes should be displayed in the top panel of the service now. If not, contact gateway support.
You cannot log in to the server because of an unclosed authentication session
Definition:
There may be cases when the user cannot log into the gateway’s user interface (the system returns the following error:
L02 Only one authentication session per human user is allowed).
Action:
- Open JavaMelody and click the View HTTP sessions button.
- Find your user and, by clicking the button on the right of each session, close the obsolete sessions.
- If the problem is not resolved, repeat the same process on each node.
Issues that must be addressed to gateway support
Definition:
There may be cases when a problem cannot be resolved, or a deeper analysis of the system state is required. When these instances occur, the issue(s) must be reported to gateway support following the guidelines below.
Action:
- Open JavaMelody, select a particular node and time period.
- Click the PDF button to export information associated with the selected node.
- Download the generated file and send it to the gateway support via a respective form available within your documentation.

Database Replication Manual Restoration Procedure
Replication issues detection
Overview
Payment gateways are designed to process real-time transactions in high volumes, which means high server loads resulting in the requirement for preserving transactional data. The required level of high-availability and fail-safety is reached due to the database replication mechanism.
Replication is the process of data storage in two separate nodes by means of frequent electronic copying of data from the primary MySQL server to the secondary. See
Configuration Diagram for more details.
Therefore, replication allows for processing requests on several servers at the same time by balancing loads across them. Replication ensures data integrity and continuous work of the application.
Replication issues detection:
In some cases the replication mechanism may be broken, for example:
- one of the servers is disconnected or has failed;
- replication is performed in GTID (global transaction identifier) mode, which is incompatible with the logic of the temporary tables used in the gateway;
- simultaneous restart of two or more database nodes;
- the replication was not started manually after one or several nodes were restarted.
Stuff you should know:
After the node restart, the database replication must be restarted manually, since this process cannot be performed automatically. You should execute the START SLAVE statement in MySQL command line for this purpose followed by the SHOW SLAVE STATUS\G statement for verification. If the replication has started successfully, you will receive the following console output:
Slave_IO_Running: Yes
Slave_SQL_Running: Yes
If the console output is different, you should try to start the replication manually one more time. If you still run into the issue, contact gateway support
In order to identify a problem with replication, a database administrator should verify the replication status on each of the database nodes in the slave mode. See the relevant section of
MySQL documentation for more information.
To verify the replication status, run the following statement in MySQL command line:
SHOW SLAVE STATUS\G
If the value returned in either of the statements,
Slave_IO_Running and
Slave_SQL_Running is “No,” there is an issue with the replication.
Slave_IO_Running: No
Slave_SQL_Running: No
Once you have identified the issue with data replication, follow the steps described below to restore database replication manually.
Preliminary steps
Make sure you have installed
Percona XtraBackup for MySQL Databases before you start or install this utility following the manufacturer’s instructions:
-
Ubuntu;
-
CentOS/ Red Hat.
Replication manual restoration
In order to restore replication in Master-Slave cluster model (when data is copied automatically from the primary server to the secondary), you should do the following:
1. Primary server:
Log in to the database server as a root user and disable replication by running a stop slave statement in MySQL command line.
2. Secondary server:
a) Run the following command in the server command line to stop MySQL server:
Ubuntu:
service mysql stop
CentOS/ Red Hat:
service mysqld stop
b) Delete the corrupted database using the following command:
rm -rf /var/lib/mysql/*
c) Launch the process of database electronic copying by creating the dump on the database node with appropriate options to be subsequently saved in
/var/lib/mysql:
ssh [primary server] xtrabackup --socket=/var/run/mysqld/mysqld.sock --backup --stream=xbstream | xbstream -x -C /var/lib/mysql/
xtrabackup --prepare --target-dir=/var/lib/mysql/ && chown -R mysql:mysql /var/lib/mysql
Wait for the successful completion to make sure that none of the typical system issues have occurred during the process.
The command executed in this step should return an output similar to the following:
InnoDB: xtrabackup: Last MySQL binlog file position 97027858,
file name mysql-bin.000005
mysql:
d) In order to restore replication from the primary server to the secondary server, it is required to obtain and save
File and
Position, from which electronic data copying from one server to another has to be restored (binary log position from which xtrabackup utility started to work). You obtained this data in step c).
Note: All figures in the instruction are provided as an example. Your data may differ from those provided in this document.
e) Run the following command in the server command line to start MySQL server:
Ubuntu:
service mysql start
CentOS/ Red Hat:
service mysqld start
f) Use the
File and
Position parameters obtained in the previous step, to restore replication with the following MySQL statements:
CHANGE MASTER TO MASTER_HOST='[name of the primary server]',
MASTER_PORT=33066,
MASTER_USER='repluser',
MASTER_PASSWORD='*********',
MASTER_LOG_FILE='mysql-bin.000005 ',
MASTER_LOG_POS=97027858;
Stuff you should know:
The password for
repulser is set during the application installation process and stored in password vault: consult the
Deployment Management Guide to learn about the file with the passwords.
g) In order to restore database replication on the Primary server (step 3), it is required to obtain the master log position (
MASTER_LOG_POS) by running the following command:
RESET MASTER
SHOW MASTER STATUS
The output will be similar to the following:
File: mysql-bin.000509
Position: 84174470
Binlog_Do_DB:
Binlog_Ignore_DB:
Executed_Gtid_Set:
1 row in set (0.00 sec)
h) Execute the
START SLAVE MySQL statement to start the replication.
After this step, data copying from the primary server to the secondary will begin.
i) Check the replication status to make sure that all previous steps were completed correctly with the following command:
SHOW SLAVE STATUS\G
If all steps were completed correctly, you will see the following message:
Slave_SQL_Running_State: Slave has read all relay logs; waiting for more updates
3. Primary server:
a) Use master log position obtained in step 2 (g) to execute the following statements:
CHANGE MASTER TO MASTER_HOST='[name of the secondary server]'
MASTER_PORT=33066,
MASTER_USER='repluser',
MASTER_PASSWORD='*********',
MASTER_LOG_FILE='mysql-bin.000001',
MASTER_LOG_POS=154;
b) Start replication and check the replication status
START SLAVE
SHOW SLAVE STATUS\G
If the replication is restored successfully, the output will contain the following information:
Slave_SQL_Running_State: Slave has read all relay logs; waiting for more updates.
Replication is restored.
Verification
In order to check the replication status after completing all steps in this instruction, you should run the following command on each database node:
SHOW SLAVE STATUS\G
If the replication was restored successfully, the following output is returned:
Slave_IO_Running: Yes
Slave_SQL_Running: Yes
If the console output is different, consult
the documentation to identify the root cause of the problem based on messages in console output. In case you need additional assistance, contact gateway support.